Churn Rate: How to Calculate Customer and Revenue Churn
Tarun · 15 November 2026 · 9 min read
Quick answer: Churn rate is the share of customers (or recurring revenue) you lose in a period: customers lost during the period divided by customers at the start, times 100. Track customer churn and revenue churn side by side, because the gap between them tells you which customers are leaving.
This guide covers the churn rate formulas you can paste into a spreadsheet, two worked examples, benchmarks with sources, and what to fix first. It is written for SaaS founders who want the number, the formula, and the first thing to change.
What is churn rate?
Churn rate is the proportion of customers who stop paying for a product during a given period, as Ahrefs defines it. It matters because customers leave when they think they are no longer getting value for their money. Measure it by customers lost or by recurring revenue lost.
Customer churn rate counts customers; revenue churn rate counts dollars of recurring revenue. The two can move in different directions, so compare them rather than average them.
Churn also splits by cause. Voluntary churn is a customer choosing to cancel; involuntary churn is a payment failing. In Recurly's churn benchmarks, based on network data (July 2026), voluntary churn is the majority of total churn in all industries, and median annual involuntary churn is 1.25% across industries.
How to calculate churn (with a worked example)
Customer churn rate = (customers lost during the period / customers at the start of the period) x 100. Revenue churn rate = (revenue lost during the period / revenue at start of the period) x 100. Pick a period, count what you had at the start, count what you lost, divide, and multiply by 100.
Step by step:
- Pick the period. A month is the common choice for SaaS.
- Count customers at the start of the period. Exclude new signups during the period from the denominator.
- Count customers lost during the period.
- Divide customers lost by customers at the start, then multiply by 100.
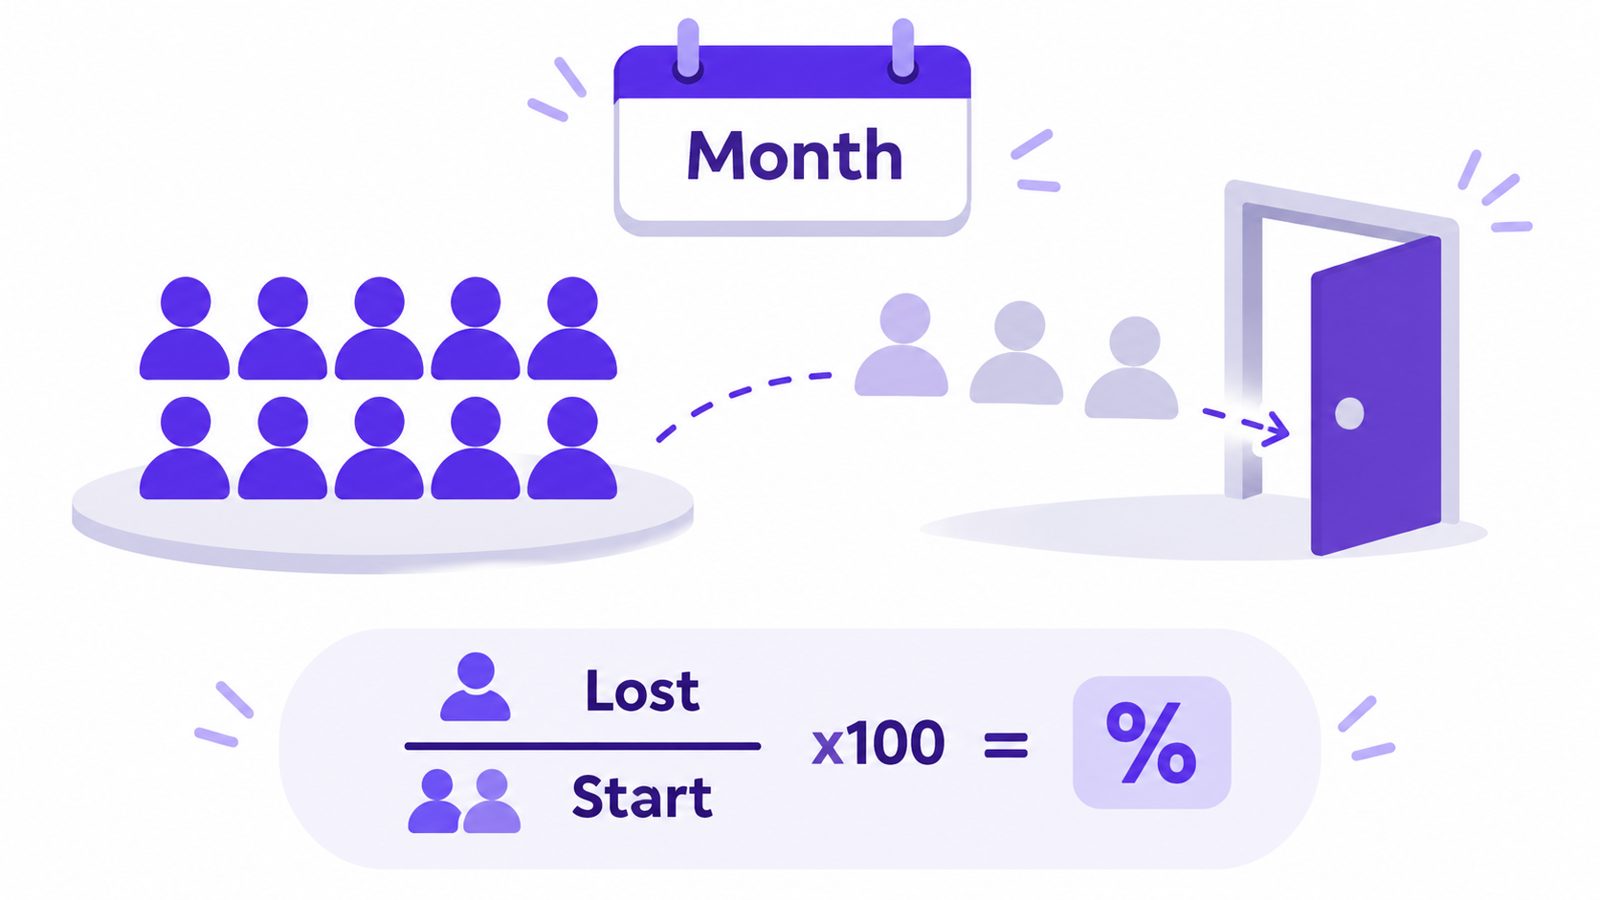 AI-generated illustration.
Worked example A — customer churn. Zuora's example: 350 customers at the start of the month, 50 lost during it. 50 / 350 x 100 = 14.3%, which Zuora rounds to 14%.
Worked example B — revenue churn. Ahrefs' example: $100K MRR at the start of the month and $1,000 of revenue lost, net of upgrades. $1,000 / $100,000 x 100 = 1%.
Net revenue churn subtracts expansion revenue from upgrades before dividing by starting revenue, so it can fall below zero when upgrades are worth more than the revenue lost.
Monthly churn compounds. The conversion, as written by Point Nine, is Annual churn = 1 - (1 - monthly churn)^12: 2% monthly becomes about 21.5% a year, and 5% monthly becomes about 46% a year.
| Metric | Formula | Example |
|---|---|---|
| Customer churn rate | (customers lost / customers at start) x 100 | 50 / 350 x 100 = 14.3% |
| Revenue churn rate | (revenue lost / revenue at start) x 100 | $1,000 / $100,000 x 100 = 1% |
| Net revenue churn | (churned MRR - expansion MRR) / starting MRR | Definition only (can go below zero) |
| Annual churn | 1 - (1 - monthly churn)^12 | 2% monthly -> about 21.5% annual |
Customer churn vs revenue churn: which one to watch
Watch both, and watch the gap between them. If customer churn is higher than revenue churn, the customers leaving had below-average lifetime value; if customer churn is lower than revenue churn, higher-value customers are the ones leaving. The two numbers together tell you who is churning, not just how many.
The revenue view matters more as deal size grows. SaaS Capital's 2025 retention benchmarks for private B2B companies describe churn as 1 - gross retention, put median net revenue retention at 102% for companies with $25K-50K ACV, and find that the highest-ACV companies have the highest gross retention. So if the accounts leaving are mostly your smallest, customer churn looks alarming while revenue churn stays low — a different problem from losing one large account.
What is a good churn rate? (SaaS churn benchmarks)
Short answer: for B2B SaaS, an annual gross revenue churn of about 10% or less is a reasonable bar. The 2025 SaaS Capital retention survey of more than 1,000 private B2B SaaS companies found a median gross revenue retention (GRR) of 91% — roughly 9% revenue churn a year — and says GRR must be at least 90% "to have a shot at performance parity with your peers". That 9% a year works out to about 0.78% a month using the conversion formula above.
What counts as good moves with price point and contract length. Median GRR from the same 2025 survey, with the implied annual gross revenue churn (churn = 1 − gross retention):
| Segment (SaaS Capital survey) | Median GRR | Implied annual revenue churn |
|---|---|---|
| All companies surveyed | 91% | ~9% |
| ACV above $250,000 | 95% | ~5% |
| ACV below $250,000 | ~91% | ~9% |
| Multi-year contracts | 94% | ~6% |
| Annual contracts | 90% | ~10% |
| Month-to-month contracts | 89% | ~11% |
| Bootstrapped companies | 92% | ~8% |
| Equity-backed companies | 90% | ~10% |
The same survey puts median net revenue retention at 101% across all companies. Two caveats: the ACV charts exclude companies under $1M ARR, and the survey is of B2B SaaS only, so very early or consumer products should not read it as their bar.
For customer (logo) churn rather than revenue churn, the widely used segment split is older. Point Nine (Clement Vouillon, 2015) put median annual customer churn at 8% (about 0.69% monthly) for mid-market and enterprise SaaS, based on a Pacific Crest survey, and median monthly user churn at 5.4% for SMB-focused companies from Open Startups data, most of which sat between 3% and 7% monthly. Recurly's network data (July 2026) adds that median annual involuntary churn is 1.25% across industries, and that B2B businesses generally run lower churn than B2C.
In practice: compare against your own segment, track the month-over-month trend, and treat a GRR below 90% — the survey's parity bar — as a signal to prioritize retention.
Why customers churn
Customers churn when they think they are no longer getting value for their money. The named causes include overpromising and underdelivering, price increases, and competitors stepping up, plus ineffective customer support, card payment declines, and poor onboarding. Most of it is voluntary: the customer decides to leave.
Overpromising and underdelivering looks like a customer who signs up on a promise the product does not keep: the marketing sets an expectation, the product falls short of it, and the customer leaves once the gap becomes clear. Tightening onboarding (below) addresses it by setting clear expectations from the start, and feedback from churned customers shows where the promise and the product diverge.
Price increases look like a wave of cancellations right after a pricing change: customers recalculate whether they are still getting value for their money, and some decide they are not. The fix below is talking to churned customers — ask churned customers whether the price itself or the value behind it drove the decision, because the two call for different responses.
Competitors stepping up looks like customers leaving for an alternative that now does something your product does not, or does it better. Talking to churned customers is the fix: ask churned customers where they went and why, and the pattern in the answers tells you what to build or change.
Ineffective customer support looks like customers hitting a problem, failing to get a useful answer, and deciding the product is not worth paying for. Educational resources such as webinars and demos can answer common questions before they turn into support tickets, and churned-customer feedback tells you how often support was the reason.
Card payment declines look different from every other cause on this list, because the customer never decides to leave: a payment fails, access ends, and the revenue is gone. This is the involuntary slice, and fixing failed payments is the answer — automated dunning with intelligent retry logic recovers revenue otherwise lost to failed payments.
Poor onboarding looks like new customers never reaching the point where the product delivers value, so they cancel early. Two steps below address it: tightening onboarding sets clear expectations and milestones backed by educational resources, and rewarding milestones lets you attach your own product credits to the onboarding steps you choose.
The split matters for what you do next. Voluntary churn is the majority of total churn in all industries, so most churn is a decision — which means expectations, onboarding, and support quality are things you control. The involuntary remainder is a payments problem with a mechanical fix, covered below.
How to reduce churn
Start with involuntary churn, because it is the most mechanical fix: automated dunning with intelligent retry logic recovers revenue otherwise lost to failed payments. Then work on voluntary churn with better onboarding, product education, and feedback from churned customers. The steps below run from the easiest to the deepest.
- Fix failed payments. Automated dunning recovers revenue otherwise lost to passive (failed-payment) churn; implement intelligent retry logic. This targets the involuntary slice.
- Tighten onboarding. Set clear expectations and milestones for achieving goals, backed by educational resources like webinars, demos, and loyalty or incentive programs. Product education is one of the voluntary-churn fixes in its own right: a webinar that walks new customers through their first milestone, or a demo that shows how to reach the goal they signed up for, helps customers reach those milestones. A practical walkthrough: how to improve SaaS activation rate.
- Reward the onboarding milestones that matter. Stickly is an engagement widget that lets SaaS founders reward their own users with their own product credits for actions the founder chooses — finishing an onboarding step, inviting a teammate, giving feedback, or a custom link — with a signed webhook granting the credits to the customer's account. Keep rewards inside your own product: GitHub's Acceptable Use Policy bans activity incentivized by credits, and Trustpilot does not allow incentivized reviews.
- Add referrals. Inviting a teammate is one of the rewardable actions above; for the program mechanics, see referral program software.
- Talk to churned customers, and make cancelling easy. Collect feedback from churned customers and make cancelling easy. Ask why they left, what they expected the product to do that it did not, whether a competitor won them over, and what would have changed their mind. Keep the questions short and consistent so the answers are easy to compare across customers. The feedback tells you which of the causes above applies to you.
If you want to reward onboarding milestones with your own product credits, Stickly is a drop-in widget for that — see how it works.
I'm Tarun, founder of Stickly.
FAQ
What is churn rate?
Churn rate is the share of customers who stop paying for a product during a given period. Customer churn counts lost customers; revenue churn counts lost recurring revenue.
How do you calculate churn rate?
Divide the customers lost during the period by the customers you had at the start of it, then multiply by 100. Zuora's example: 50 lost out of 350 at the start of the month is about 14%.
What is the difference between customer churn and revenue churn?
Customer churn counts accounts; revenue churn counts dollars, for example Ahrefs' $1,000 lost (net of upgrades) from $100,000 MRR is 1%. If customer churn is higher than revenue churn, the customers leaving had below-average lifetime value; if it is lower, higher-value customers are leaving.
How do I convert monthly churn to annual churn?
Use annual churn = 1 - (1 - monthly churn)^12. A 2% monthly rate compounds to about 21.5% a year, and 5% monthly to about 46% a year.
What is a good churn rate for SaaS?
For B2B SaaS, annual gross revenue churn of about 10% or less is a reasonable bar. SaaS Capital's 2025 survey of 1,000+ private B2B SaaS companies found median gross revenue retention of 91% (about 9% revenue churn a year) and says it should be at least 90%; companies with ACVs above $250,000 show a 95% median. Compare against your own segment and your month-over-month trend.
Is 5% monthly churn good?
Usually not for B2B. 5% a month compounds to about 46% a year (1 - 0.95^12). That is near Point Nine's 2015 median monthly user churn for SMB-focused SaaS (5.4%), but far above the roughly 9% annual revenue churn implied by SaaS Capital's 2025 median 91% gross retention for private B2B SaaS (customer churn and revenue churn are different measures).